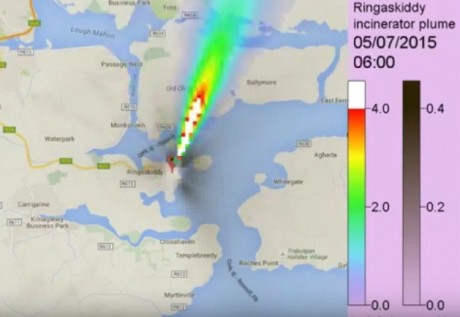
Ringaskiddy incinerator live Plume Plot launched
 cork |
environment |
press release
 Tuesday April 26, 2016 15:44
 by CHASE - Cork Harbour Alliance for a Safe Environment

CHASE has launched a plume plotter for the proposed 240,000 tonne incinerator at Ringaskiddy Co Cork. Developed by plumeplotter.com it provides a real time map image modelling ground-level pollution from the incinerator plume, modelled using AERMOD taking incinerator specifications provided by Indaver in their EIS, current weather data from local weather stations, Ordnance Survey (OS) data for places and NASA data for terrain.
Residents in the Cork Harbour area and far beyond can use the plume plotter to see pollutant dispersal at any given time on www.plumeplotter.com/ringaskiddy.

Pollutants measured include Oxides of nitrogen, PM10 Particulates, Heavy metals and dioxins. Plume Plotter also provides a breakdown of the increase of these pollutants above the background levels provided by Indaver in their application.
A 1.26 minute video model of pollutant dispersal through the year 2015, had the incinerator been in operation, has been released on You Tube on https://youtu.be/QTsBWMPO_vc (30km zoom) or https://youtu.be/bpD-7rxL5iI (15km zoom). This animation uses Met Eireann data for Cork Harbour for 2015, combined again with OS, NASA and Indaver information.
The 2015 model shows the maximum buildup of pollutants in the area circling from West of the incinerator just outside Carrigaline, to South South East of the Incinerator near the mouth of the Harbour and with the Maritime College, Haulbowline Naval Base and iMERC Campus in the most polluted zone.
CHASE spokesperson Linda Fitzpatrick said “Unlike the complicated tables presented by Indaver, the plume plotter provides a visual model of the same data which enables people to understand far more clearly the fallout model from the proposed incinerator. It models exactly what areas would be most affected, and the annual buildup model shows a dispersal far beyond what many may realise. In the time which we have been monitoring, we have seen days with some pollutant concentrations increased several hundred precent above background levels.”
The plume plotter is based on AERMOD, because that is what Indaver use in their EIS. It is developed by the US EPA, and takes account of the real terrain in the vicinity of the incinerator, current weather conditions, upper air data, as well as properties of the incinerator emissions and the shape of the incinerator buildings.
Plume Plotter will also be used this week during the Oral Hearing to highlight incorrect or missing scenarios from Indavers Environmental Impact Study.
The videos can be viewed here:
Dispersal for a 15 x 15 km area: https://youtu.be/bpD-7rxL5iI
Dispersal for a 30 x 30 km area: https://youtu.be/QTsBWMPO_vc
 cork |
environment |
press release
 Tuesday April 26, 2016 15:44
 by CHASE - Cork Harbour Alliance for a Safe Environment


 printable version

 Digg this
 del.icio.us
 Furl
Furl Reddit
 Technorati
 Facebook
 Gab
Gab Twitter
View Full Comment Text
save preference
Comments (1 of 1)